Visiting
In the second year of my PhD
In July 2024, I had the privilege of visiting A/Prof. Ursula Laa at the University of Natural Resources and Life Sciences, Vienna (BOKU University), accompanied by Prof. Di Cook, Prof. Eun-Kyung Lee, and A/Prof. Natalia da Silva. This visit was a valuable learning experience, where I had the opportunity to engage with the visitors, the academic staff and students at BOKU University and gain insights into their research work. I received constructive feedback on how to enhance my work and how it can contribute to their ongoing projects. I am deeply grateful to my main supervisor, Prof. Di Cook, for organizing this visit, and to A/Prof. Ursula Laa for graciously inviting me.
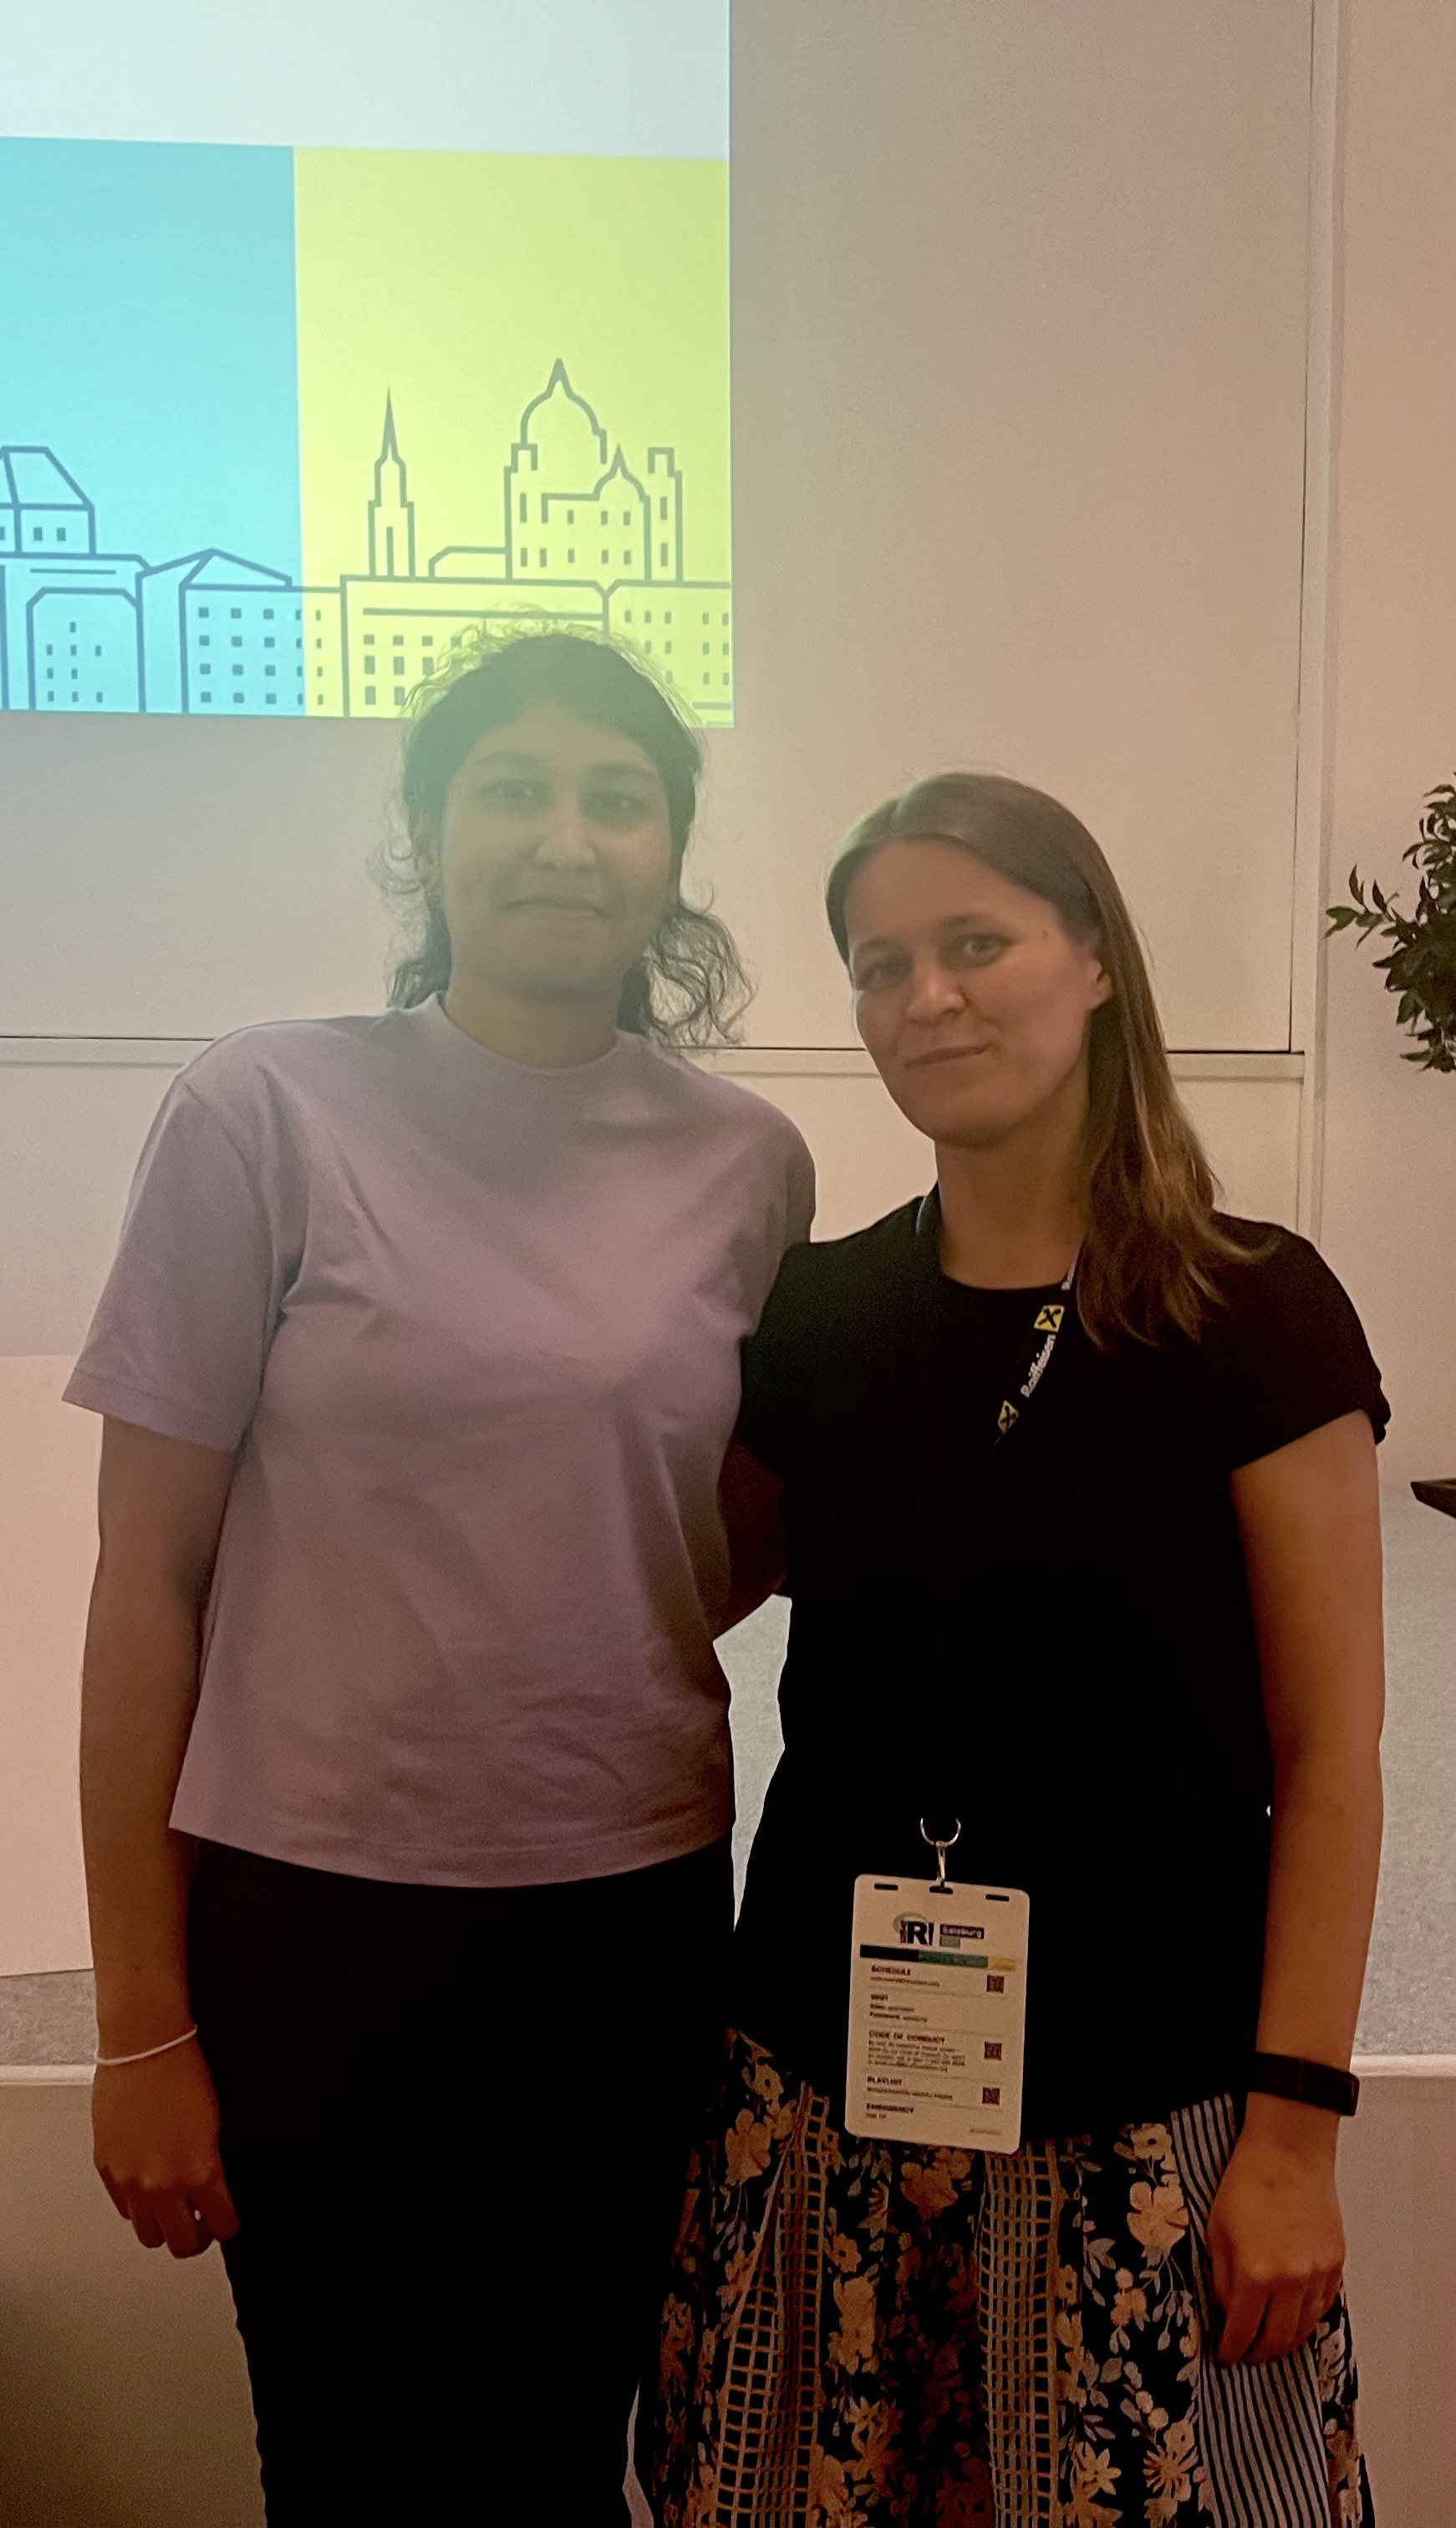
With A/Prof. Ursula Laa
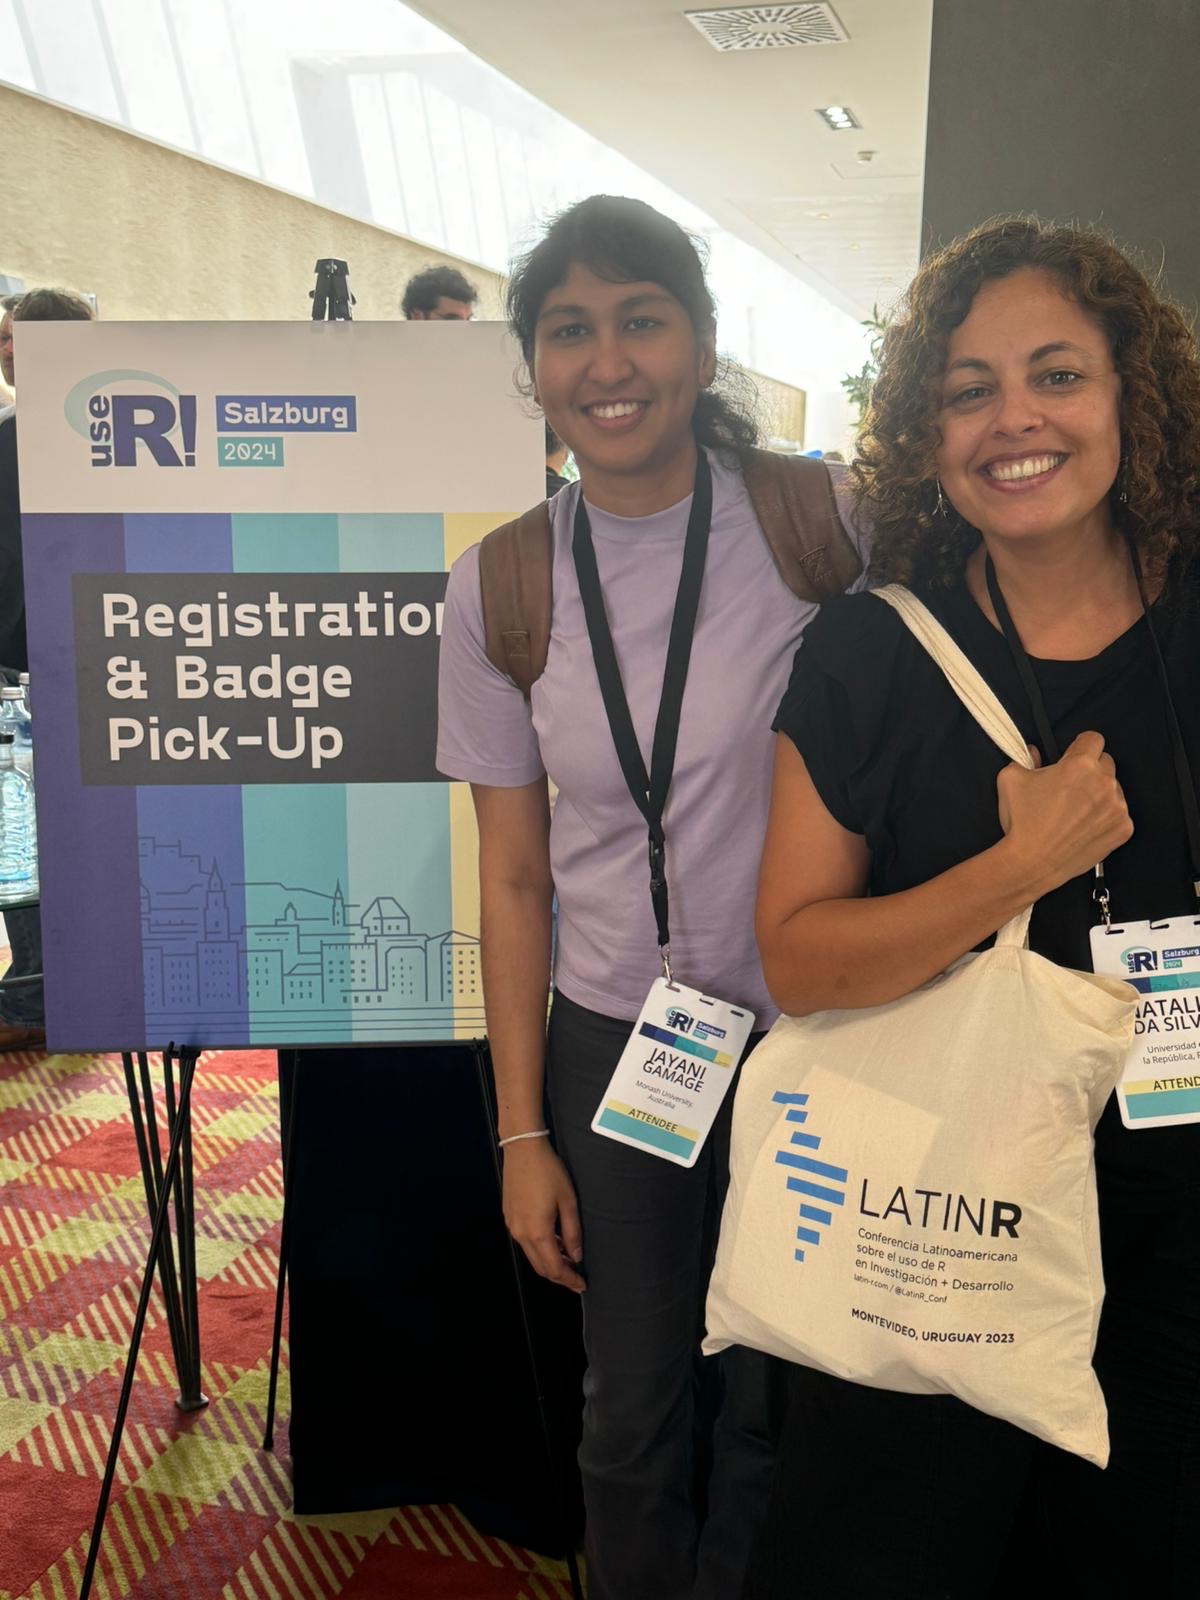
With A/Prof. Natalia da Silva
In the Third Year of My PhD
From late October to late December 2024, I had the incredible opportunity to visit Prof. Heike Hofmann, A/Prof. Susan Vanderplas, and Dr. Michelle Graham at the University of Nebraska, Lincoln, USA (UNL).
During my time there, I presented my research to their group, sharing insights into high-dimensional data visualization and dimension reduction techniques. I also actively participated in the Nebraska R User Group meetings and the Graphics Group discussions (Graphics Group Blog), which provided enriching experiences and opportunities for collaboration.
I am deeply grateful to my main supervisor, Prof. Di Cook, for organizing this visit, and to Prof. Heike Hofmann and A/Prof. Susan Vanderplas for graciously inviting me. I would also like to thank Dr. Michelle Graham for taking the time to visit me while I was there.
Below are some useful links that I found helpful for learning and exploring new concepts:
The state‐of‐the‐art on tours for dynamic visualization of high‐dimensional data. Lee, Stuart, Wiley interdisciplinary reviews. Computational statistics, 14( 4 ), 2022-07.
langevitour: Smooth Interactive Touring of High Dimensions, Demonstrated with scRNA-Seq Data. 2023-06-01.
Hole or Grain? A Section Pursuit Index for Finding Hidden Structure in Multiple Dimensions. Laa, Ursula, Journal of computational and graphical statistics, 31( 3 ), 2022-07-03, 739 - 752.
Tourr: An R package for exploring multivariate data with projections. Wickham, Hadley, Journal of statistical software, 40( 2 ), 2011-04-01, 1 - 18.
Penguins Go Parallel: A Grammar of Graphics Framework for Generalized Parallel Coordinate Plots. VanderPlas, Susan, Journal of computational and graphical statistics, 32( 4 ), 2023-10-02, 1572 - 1587.
Parallel coordinate and parallel coordinate density plots. Moustafa, Rida E., Wiley interdisciplinary reviews. Computational statistics, 3( 2 ), 2011-03, 134 - 148.
Judging correlation from scatterplots and parallel coordinate plots. Li, Jing, Information visualization, 9( 1 ), 2010-03-01, 13 - 30.
Measuring Lineup Difficulty By Matching Distance Metrics With Subject Choices in Crowd-Sourced Data. Chowdhury, Niladri Roy, Journal of computational and graphical statistics, 27( 1 ), 2018-01-02, 132 - 145.
Testing Perceptual Accuracy in a U.S. General Population Survey Using Stacked Bar Charts. Rice, Kiegan, Journal of data science, 2024, 280 - 297.
Spatial Reasoning and Data Displays. Vanderplas & Hofmann. https://ieeexplore-ieee-org.libproxy.unl.edu/document/7217849.
This visit was an invaluable experience, broadening my perspective and fostering meaningful exchanges with experts in the field.
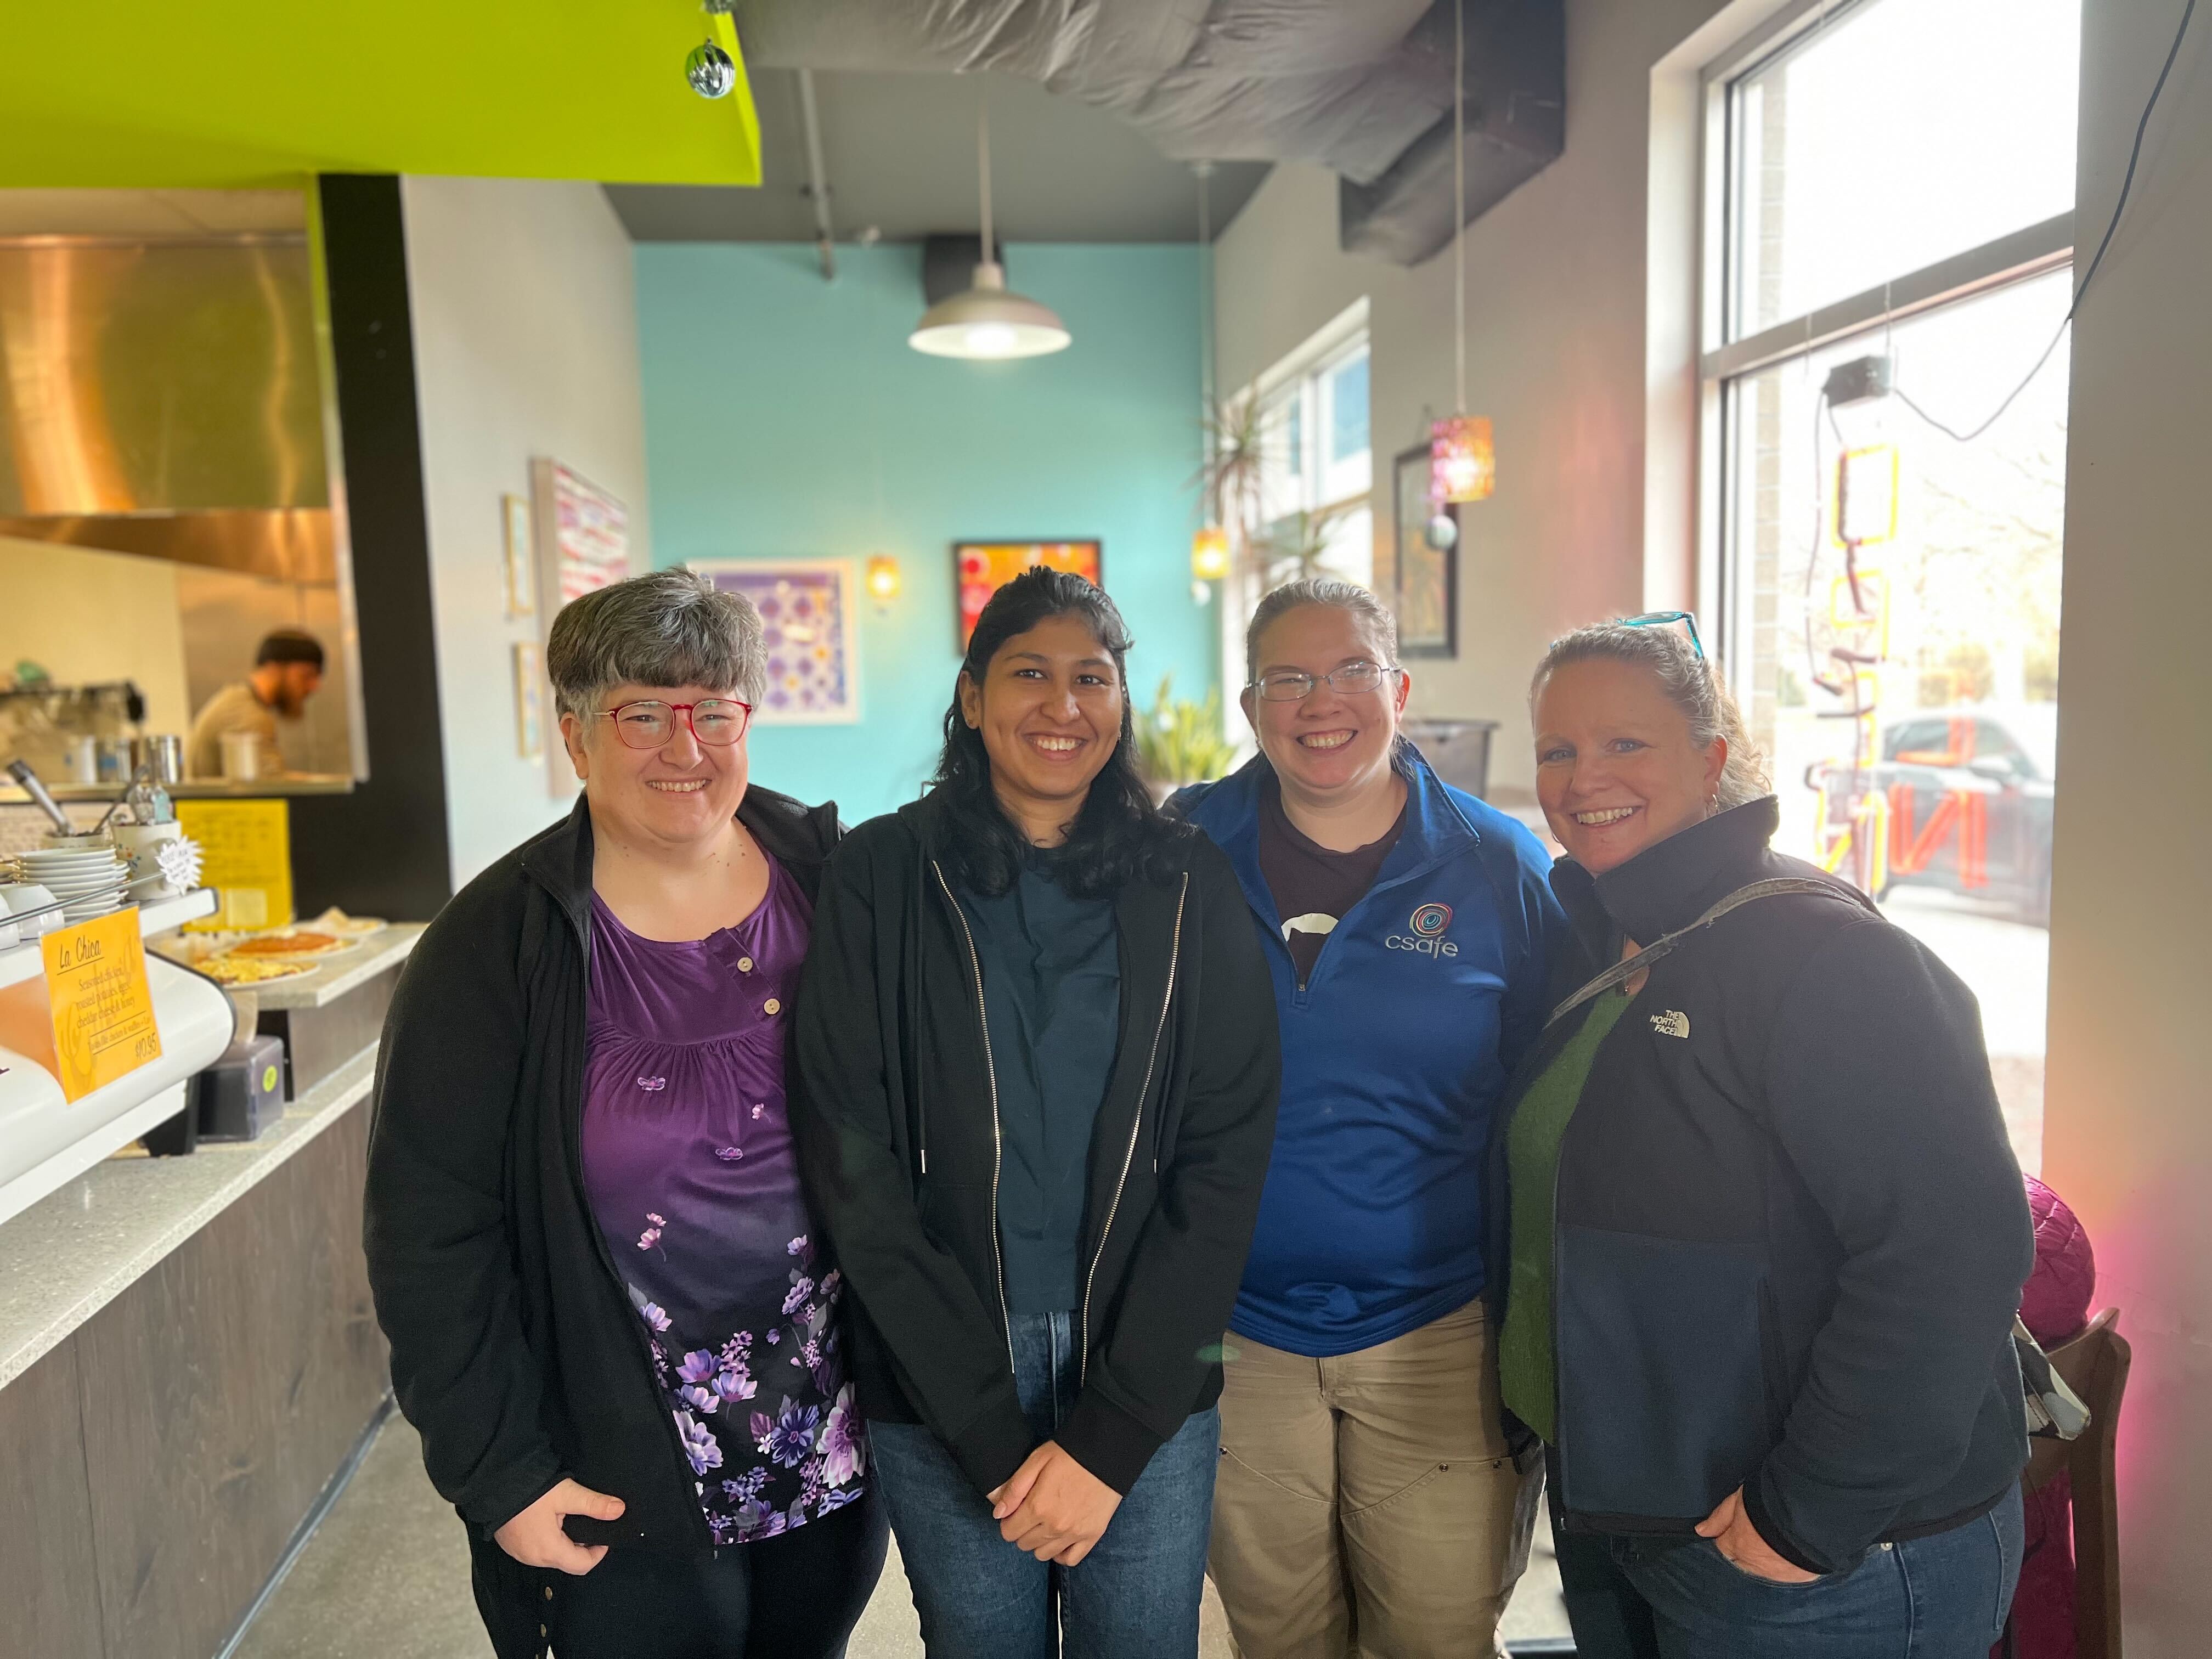
With Prof. Heike Hofmann, A/ Prof. Susan Vanderplas, and Dr. Michelle Graham